Diagramm – die neusten Beiträge

Excel-Diagramme

Hallo,

ich habe folgendes Problem :

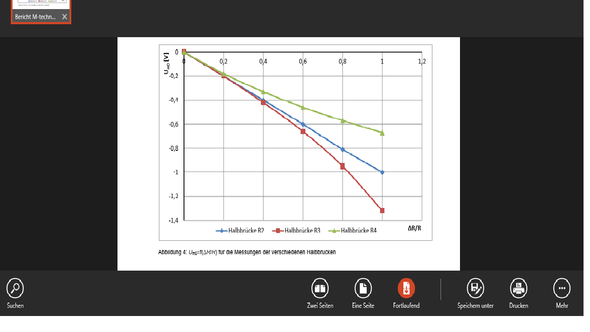
Für ein Praktikum in der Uni muss ich ein Diagramm mit Hilfe von Excel erstellen. Anfangs dachte ich ist ja nicht so schwer, doch dann stellte sich folgendes Problem auf :

Ich soll die Werte von Ua
0,003
0,625 1,25 1,875 2,5 3,125 3,75 4,375 5 5,625 6,25 6,875 7,5 8,125 8,75 9,375 und die Werte von Uv 0,625 1,25 1,875 2,5 3,125 3,75 4,375 5 5,625 6,25 6,875 7,5 8,125 8,75 9,375

auf der Y-Achse auftragen und auf der X-Achse sollen die Werte von (0,1,2,3......,15) stehen. 
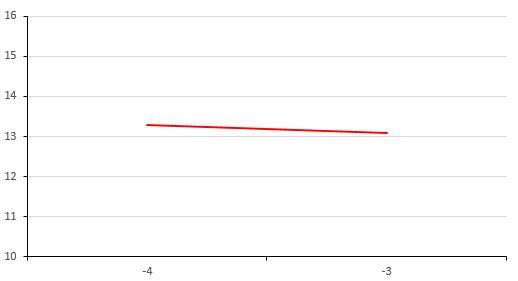
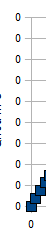
Das Diagramm bekomm ich auch hin, aber dann scheitert es daran das die Differenz, der einzelnen Werte, so klein ist, dass Excel mir das nicht vernünftig darstellen kann ( es liegt nicht an Excel, sonder an mir, das weis ich auch :D ) D.h im Grunde, dass sich die einzelnen Punkt überdecken und größten Teils kaum sichtbar ist, dass es sich um zwei eigenständige Funktionen handelt. Ich hab schon alles mögliche versucht und auch ausprobiert mit Skalierung ändern etc., aber nicht half, machte es eher noch schlimmer. Also wenn mir jemand helfen könnte wäre das echt sehr nett :)

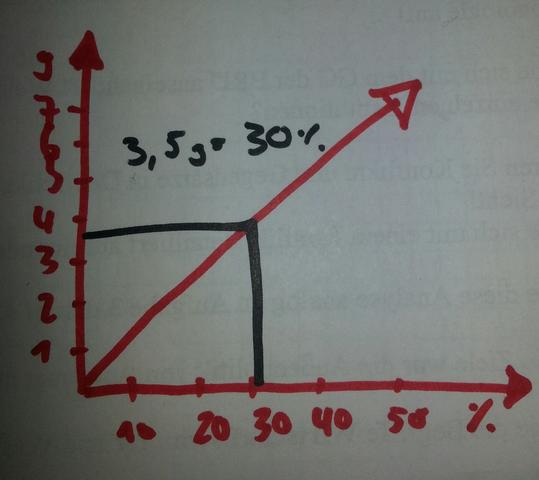
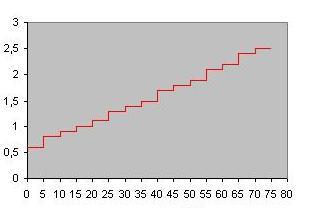
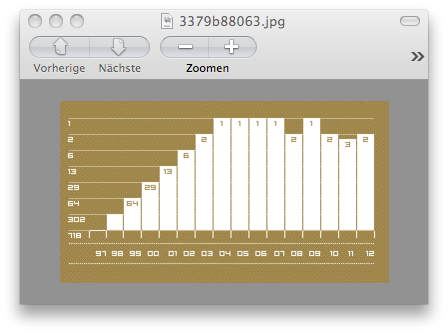
Ich werde auch noch ein Bild anhängen wie es am Ende aussehen soll (Stufentabelle), vorab schon mal ich wollte mir durch Excel nur die Punkte der beiden Graphen darstellen lassen und sie dann per Hand verbinden ( auf das angehängte Foto bezogen)

MfG

Schubbydu 8)

P.s Alles was mit Grammatik und Syntax oder sonstigem zutun hat interessiert mich nicht :) also einfach gar nicht ansprechen.

Bild zum Beitrag
Microsoft Excel, Diagramm

Talking about charts - Diagramme beschreiben - Text korrigieren?!

Hallöchen Leute! Wir sollten am Montag eine Survey (Umfrage) vorberiten und diese sollen wir am Freitag präsentieren, nur bin ich nicht soooo gut in Englisch und weiß nun nicht ob mein Text richtig ist, oder ob ich noch irgendwas ergänzen oder verbessern könnte/ müsste/ sollte... Es wäre also echt total lieb von euch, wenn ihr mir dabei helfen könntet und ich wäre euch auch zutiefst dankbar dafür!!! Also schon mal ein Dankeschön im vorraus. Lg Cersia <3


Bewerten sie die Qualität unseres Bildungssystems von sehr schlecht (1) bis perfekt (10). - Assessment of (the quality of) our educational system, 1 means very bad and 10 means perfect.

Diagramm 1: The bar chart depicts ten options, which the students, on the invitation: “Assessment of (the quality of) our educational system?” could tick, where 1 means very bad and 10 means perfect. The options scale is on the horizontal axis and the percentage terms scale runs vertically. Only slightly more than 45% of the sample had answered that they guessed our educational system is a little more than the average, but it is not perfect. As opposed to this only a small fraction of the adolescences answered that our educational system is very bad.

Wie bewerten sie die Stellung der Jugendlichen in der Gesellschaft im Vergleich zu anderen Ländern? (1- besser als in anderen Ländern, 10- wir haben es am schlechtesten) - How would you assess the role of teenagers in our society when you compare it with other countries?

Diagramm 2: The diagram represents, whether the students assess the role of teenagers in our society, therefore shows that the majority of questioned adolescence be of the same opinion that the role of teenager in Germany are better than other countries. Significantly fewer students answered that the role of young people in Germany are not as good as in other countries.

Was ist für sie der negativste Aspekt am Teenager-Leben in Deutschland?- What is the most negative aspect of a teenager life in Germany?

Diagramm 3: The pie chart illustrates in percentage terms, what youngsters think is the most negative aspect of a teenager life in Germany. The pie chart depicts, that the section “few restrictions” had exactly the same percentage as the section “none”. The stages “few comities”, “few restrictions” and “education” combined are more than half. The answer “few self-determination” makes up for 20 %. This is in sharp contrast to the answer “stress” or “to divide into groups”, only 3 students had answered that one of this section is the most negative aspect of a teenager life in Germany.

Bild zum Beitrag
Englisch, Diagramm, Text, korrigieren, besichtigen

Meistgelesene Beiträge zum Thema Diagramm