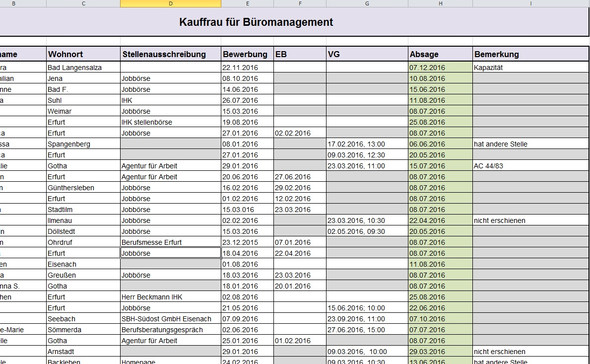
Hey, also ich fang mal von ganz vorne an. Im Moment machen wir im Informatikunterricht mit Excel Bekanntschaft. Wir haben von unserem Lehrer Zettel bekommen mit Aufgaben usw. Ich war mal wieder als erstes fertig und habe eine Extra-Aufgabe bekommen. Ich sollte alle Namen, Geburtsmonate, Geburtsjahre, Wohnorte, Augenfarben und Haarfarben in einer Excel-Tabelle zusammenfassen.Also zum Beispiel: Laura, Januar, 2003, Frankfurt am Main, Braun, Blond
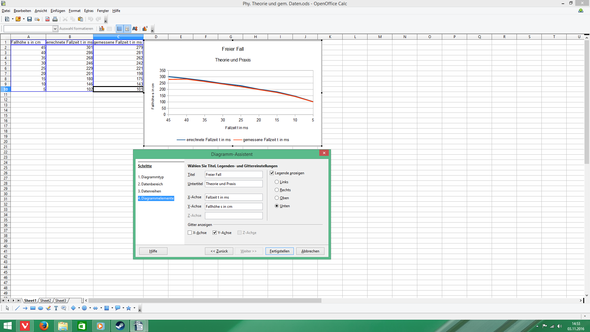
Mein Lehrer wollte halt, dass man en paar Daten, wie man will, in ein Diagramm einfügen kann. Allerdings haben wir dann gemerkt, dass das nicht geht, da man ja Werte für ein Diagramm braucht, haben es aber zu fünft nicht hinbekommen. Nun soll ich das als Hausaufgabe herausfinden und meine gefühlt 10.000ste Kurzpräsentation darüber halten (macht mir aber Spaß).
Meine Frage: Wie kann man in Excel ein Diagramm nur aus Wörtern bestehend erstellen?
Ich habe mal gelesen, dass man das mit einer Hilfsspalte machen kann, weiß aber nicht was das ist bzw. wie das geht.
Oder habt ihr Formeln etc.?
Ich freue mich über ernst und evtl. ausführliche Antworten
LG Franzi