Diagramm beschreiben?
Würdet ihr was an meinem Text verbessern?
Aufgabe: Describe the diagram on page 53.
Das Diagramm + Hilfen:
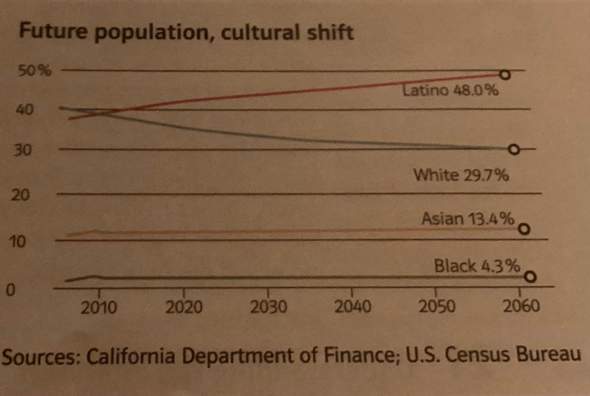
Meine Beschreibung: The following chart is a line graph and was published by the "California Department of Finance, U.S. Census Burreau". The line graph is about the population of California and shows in percent the future population/cultural shift in the years 2010 to 2060 with the four groups: Latino, White, Asian and Black.
Most people are white, 40 percent in 2010, but the number of whites drops steadily. 33 percent in 2030 and 29.7 percent in 2060. The next largest group, with slightly fewer people, are Latinos, 38 percent in 2010, but the number of Latinos goes up steadily. 44 percent in 2030 and 48 percent in 2060. A minority of the population is Asian in 2010 at 12 percent, but the number will doesnt change at around 13.4 percent until 2060. The biggest minority of the population is Black in 2010 at 3 percent, but the number will doesnt change at around 4,3 percent until 2060.
1 Antwort
Hallo,
... will doesn't change (Diese Konstruktion gibt es nicht.) at (falsche Präposition) around 13.4 percent until 2060.
.... will doesn't change (Diese Konstruktion gibt es nicht.) at (falsche Präposition) around 4,3 percent until 2060.
... wird sich bis 2060 nicht auf ca. xx Prozent ändern? - unverständlich.
Achtung!
Anders als im Deutschen, werden im Englischen
die Tausenderstellen mit einem Komma (The number of people out of work fell by 50,000)
und
die Dezimalstellen mit einem Punkt (The unemployment rate fell to 7.9% from 8.1%.)
abgetrennt.
Damit sind
€12.60 (englisch) und € 12,60 (deutsch)
1,995 one thousand nine hundred ninety-five und
1.995 = one point nine nine five
1989 = nineteen hundred (and) eighty-nine, nineteen eighty-nine
10.548 = ten point five four eight
10,548 = ten thousand five hundred (and) forty-eight
9,984,670 (korrekte englische Schreibweise) Man sagt nine million, nine hundred and eighty-four thousand, six hundred (and) seventy.
---------------
Unter folgenden Links findest du Wendungen zum Beschreiben englischer Diagramme, Tabellen usw.:
- https://www.englisch-hilfen.de/en/words/charts.htm
- eslflow.com/describinggraphstables.html
:-) AstridDerPu
So?
The following chart is a line graph and was published by the "California Department of Finance, U.S. Census Burreau". The line graph is about the population of California and shows the future population/cultural shift in percent from 2010, slightly earlier, to 2060 with four groups: White, Latino, Asian and Black.
Most people are white, 40 percent before 2010, but the number of whites drops steadily. There is an overlap with Latinos at 38 percent in 2010, 33 percent in 2030 and 29.7 percent in 2060. The next largest group, with slightly fewer people, are Latinos, 37 percent before 2010, but the number of Latinos goes up steadily. In 2010 they overlap with whites at 38 percent, 44 percent in 2030 and 48 percent in 2060. A minority of the population is Asian, 12 percent before 2010, but the number will remain at around 13.4 percent until 2060. The largest minority in the population is black, 3 percent before 2010, but this will remain at around 4.3 percent until 2060.