Frage
Antwort
Vom Klimawandel geprägt
Für sowas verwende ich gerne die Zusammenfassungen der NOAA bzw. des NCEI, die das für einzelnen Monat und das Gesamtjahr macht:
Annual 2011 Global Climate Report
Global Highlights- This year tied 1997 as the 11th warmest year since records began in 1880. The annual global combined land and ocean surface temperature was 0.51°C (0.92°F) above the 20th century average of 13.9°C (57.0°F). This marks the 35th consecutive year, since 1976, that the yearly global temperature was above average. The warmest years on record were 2010 and 2005, which were 0.64°C (1.15°F) above average.
- Separately, the 2011 global average land surface temperature was 0.8°C (1.49°F) above the 20th century average of 8.5°C (47.3°F) and ranked as the eighth warmest on record. The 2011 global average ocean temperature was 0.40°C (0.72°F) above the 20th century average of 16.1°C (60.9°F) and ranked as the 11th warmest on record.
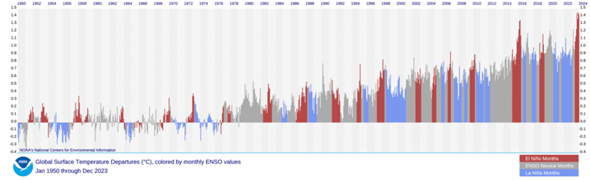
- La Niña, which is defined by cooler-than-normal waters in the eastern and central equatorial Pacific Ocean that affects weather patterns around the globe, was present during much of 2011. A relatively strong phase of La Niña opened the year, then dissipated in the spring before re-emerging in October and lasting through the end of the year. When compared to previous La Niña years, the 2011 global surface temperature was the warmest observed during such a year.
- The 2011 globally-averaged precipitation over land was the second wettest year on record, behind 2010. Precipitation varied greatly across the globe. La Niña contributed to severe drought in the Horn of Africa and to Australia's third wettest year in its 112-year period of record.
---
2011 war also trotz eines kühlenden(!) El Nino das 11-wärmste seit dem Beginn der globalen Reihe der NOAA in 1880. Und damals auch das wärmste E-Nino-Jahr.
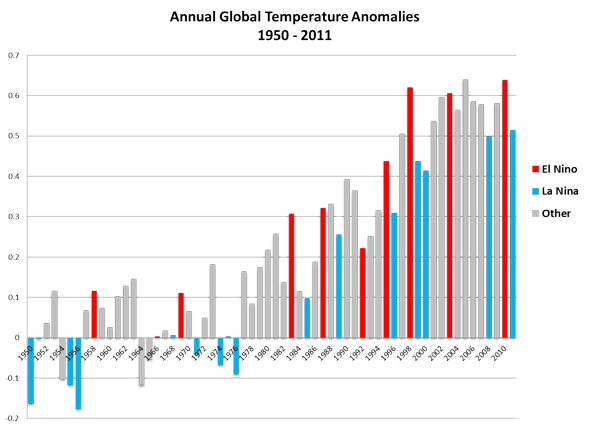
Gleichzeit war es das 35.ste Jahr in Folge seit 1976, in dem die Temparaturen höher waren als der Durschnitt im 20. Jahrundert.
Ja, das würde ich als vom Klimawandel geprägt bezeichnen.
---
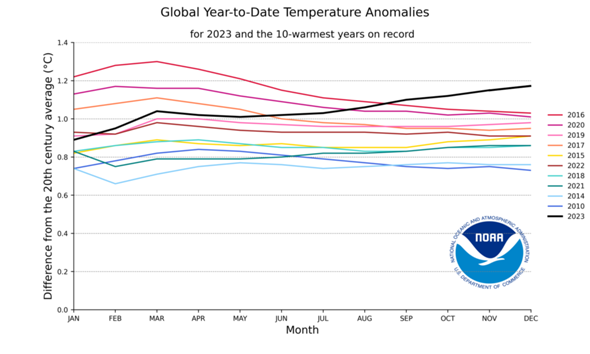
Um das auch zum heutigen erschreckenden Zustand einzuordnen, hier die entsprechende Grafik für das Jahr 2023: